Prototyping a Greenhouse Management System with Node-RED and Predix in 48 Hours

In the agriculture industry, the Internet of Things helps to build smart farming systems. Using information from sensors and machinery, such solutions enable farmers to optimize their decisions and overcome many challenges they face.
With proper technologies and expertise at your disposal, these systems can be created in a very reasonable amount of time. Here are the details about the prototype of an automation system for greenhouse farming that we managed to create in 48 hours—employing Raspberry Pi 3, an I2C light sensor, Node.js, and GE Predix.
Description of the prototype
The problem we wanted to address by implementing this prototype was the automation of greenhouse farm management. On the market today, you will hardly find a platform that provides complex management for industrial greenhouse farms.
With such a solution available, it is possible to integrate all automation applications into one system that manages farms as a whole and optimizes resource utilization across the greenhouses.
We included the following functionality in our platform:
- Gathering light data from multiple devices connected to Wi-Fi
- Saving and processing this data using Predix Time Series
- Displaying greenhouse farm health
- Displaying farm structure
- Displaying sensor data charts and statistics for greenhouses
The prototype was first presented at the Cloud Foundry Summit 2016 in Santa Clara, CA.
Hardware
To assemble edge devices, we used:
- Raspberry Pi 3
- Adafruit Light Sensor TSL2561
- Breadboard
- Green LED, push button, and wires
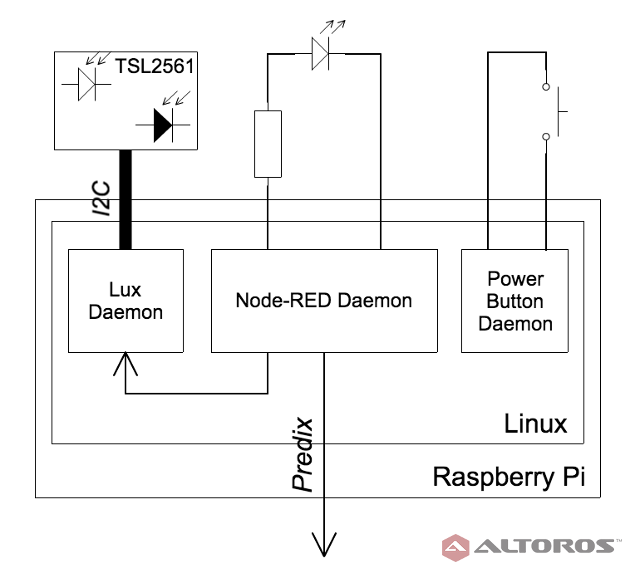 Figure 1. Hardware and software integration diagram
The TSL2561 sensor was connected to the power and I2C pins of Raspberry Pi on the breadboard (see Figure 1).
The LED was connected to one of the programmable pins set to logic 1 (3.3 V) by default and to a 5 V power source. Switching this pin to logic 0 (0 V, GRND) allows us to deliver 5 V to the LED and increase the power of its flash. Also, the push button was made to gracefully shut down the device.
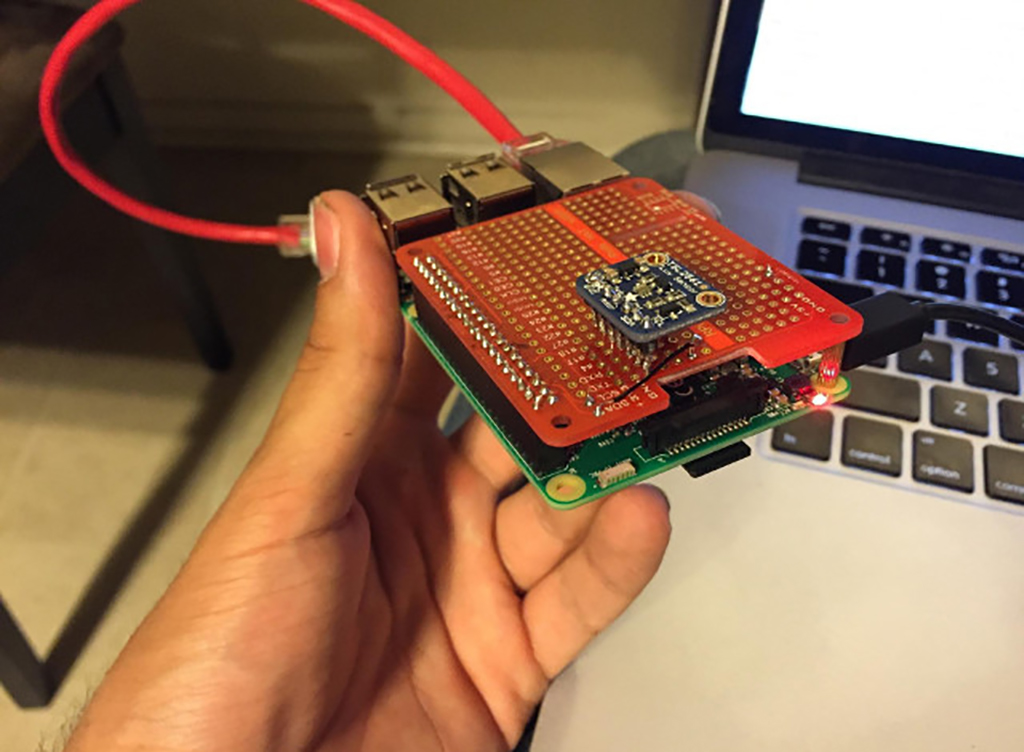 Figure 2. Raspberry Pi-based device
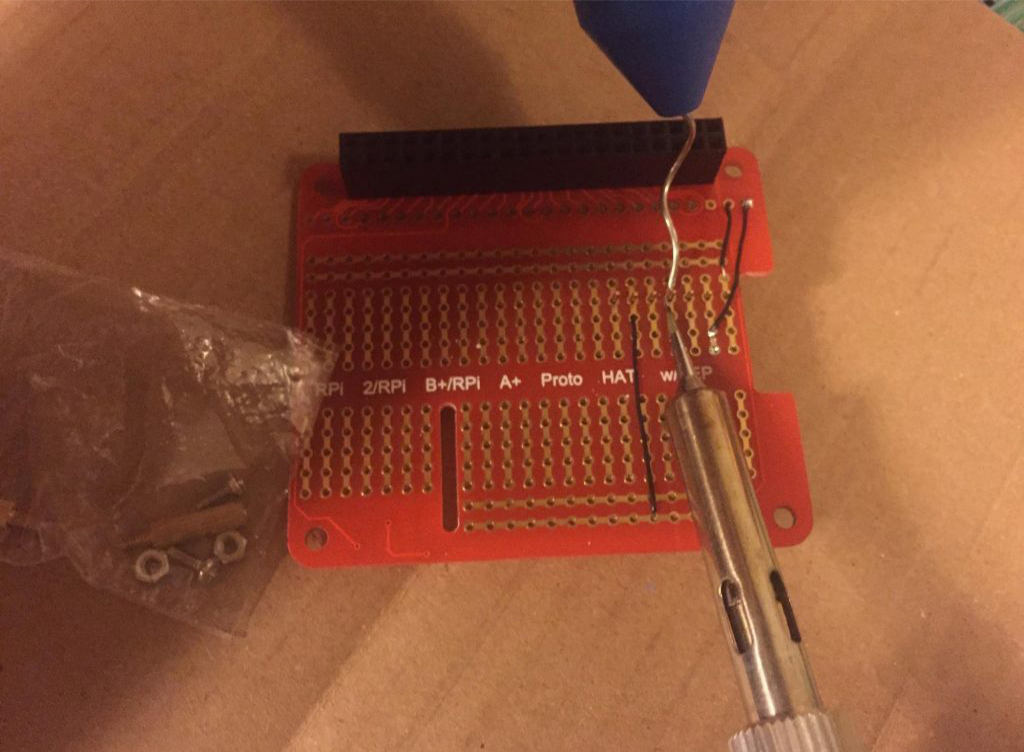 Figure 3. Soldering components to the breadboard
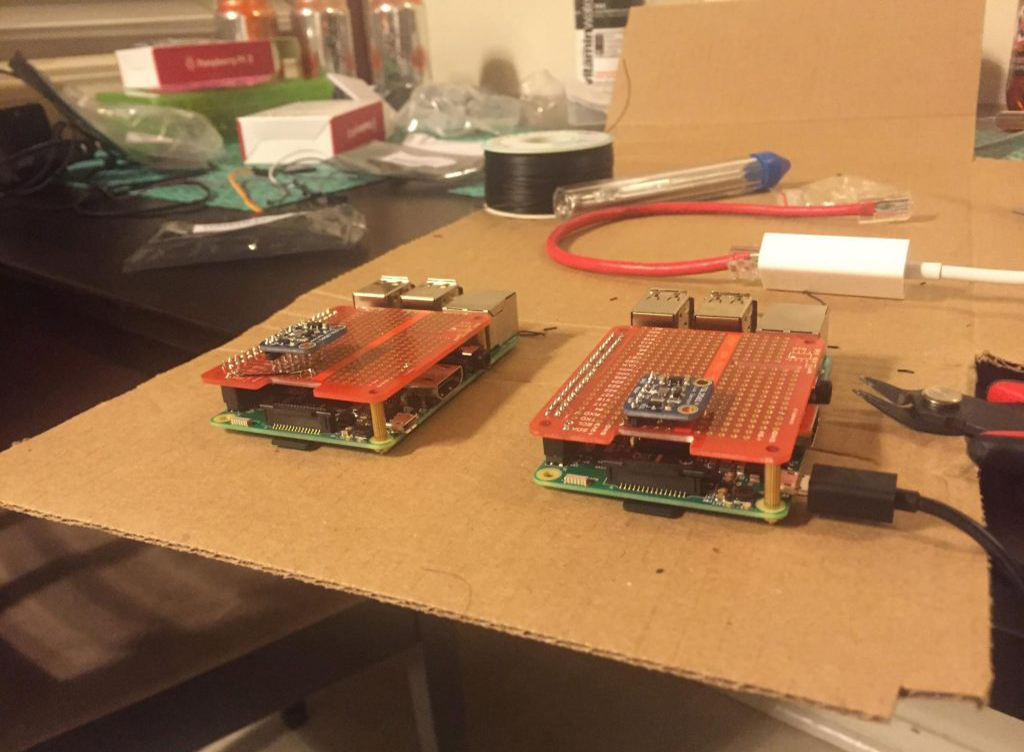 Figure 4. Devices ready for demo
Software
Let’s move on to the software required to make the devices work. Using the architectural principles of Linux systems, our application can be split into a set of daemons. Each daemon is responsible for only one role in the system:
Node-RED saves sensor data to Predix. Node-RED is a tool that provides you with a visual domain-specific language for building and deploying data processing workflows in minutes. It is quite a good fit for prototyping and configuring existing systems in runtime. At Altoros, we developed a custom set of components for Node-RED that allows you to process data using GE Predix.
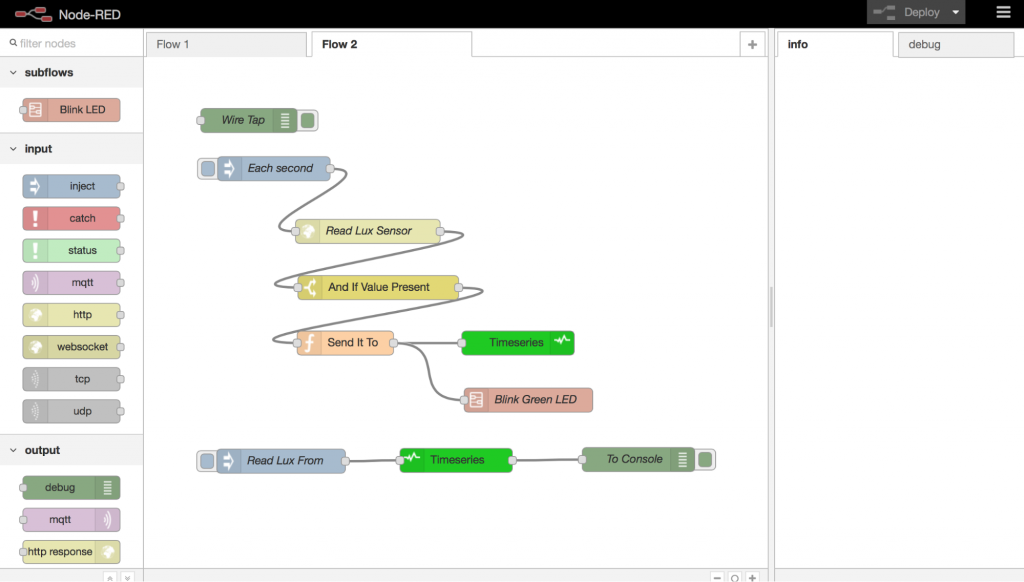 Figure 5. Node-RED ingestion flow
Our Node-RED flow is fairly simple. The system generates messages every second, reads light data from the sensor, and sends it to the Predix Time Series service. Also, in parallel, it flashes the LED when the data is sent to the cloud (Figure 5).
 Figure 6. Node-RED flow for flashing the LED
The flow for flashing the LED is also simple: turn on the LED, wait 50 ms, and then turn off the LED (Figure 6).
Lux provides access to the TSL2561 component and allows you to gather light data. It is written using Node.js and employs the WiringPi and Express libraries. Using the I2C protocol, the Lux daemon reads data from two light sensors provided by TSL2561. Then, it calculates the light value in lux. This functionality is exposed through a REST API built on the Express library. You can find the source code of the Lux daemon in this GitHub Gist.
- Power Button shuts down the device when the specified button is clicked. The code for the power.js file:
var gpio = require('rpi-gpio');
var exec = require('child_process').exec;

function noop() { }

gpio.on('change', function(channel, value) {
 console.log('Channel ' + channel + ' value is now ' + value);
 exec('halt', noop);
});

gpio.setup(7, gpio.DIR_IN, gpio.EDGE_FALLING);
The code for the Power-Off-Button.service file:
[Unit]
Description=App that shutdown device when button pressed

[Service]
Type=idle
User=root
ExecStart=/usr/local/bin/node /home/pi/Projects/power-off-button/main.js
Restart=always

[Install]
WantedBy=multi-user.target

Greenhouse management application
For the cloud part of our system, we developed a microservice-based application—to accelerate its implementation. Each of the components can now be easily combined from a set of ready-to-use services in Predix. (Below is a high-level architecture of the application deployment.)
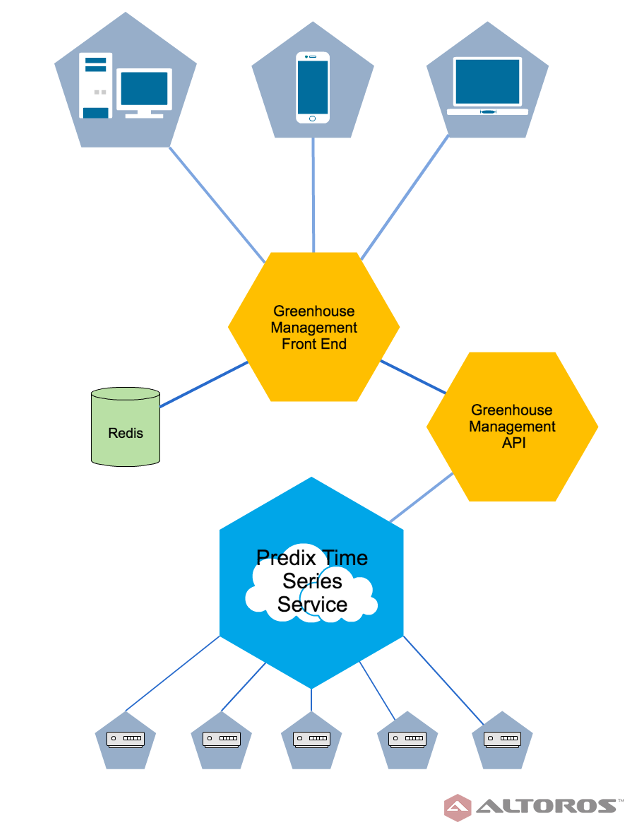 Figure 7. Deployment architecture of the greenhouse management app
The app consisted of two services:
Node-RED implementation of a REST API for querying the Predix Time Series service (Figure 8)—it is a basic Node-RED flow that creates a correct Time Series JSON query, executes it, and converts the result to the format expected by the front end.
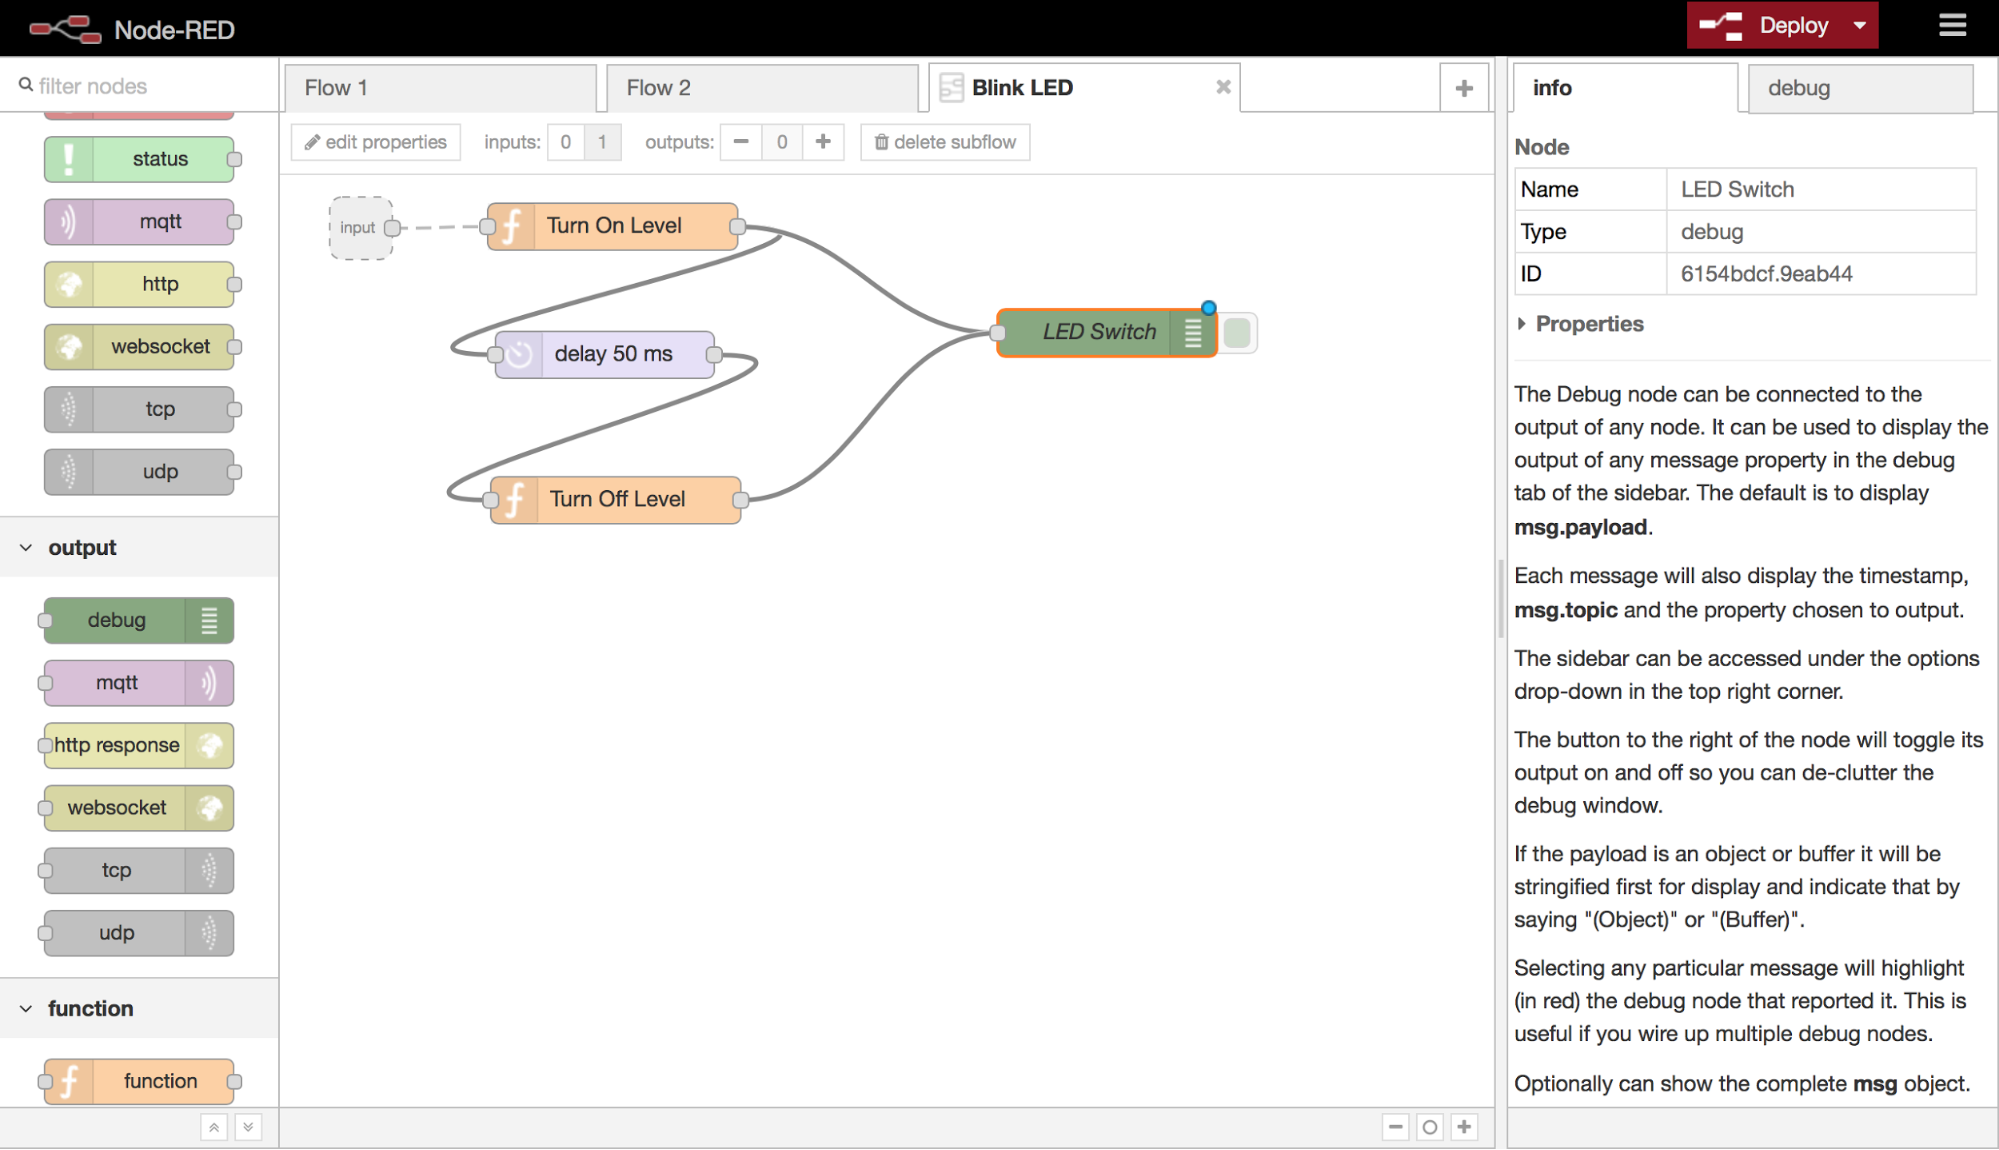 Figure 8. Node-RED flow that implements the required REST API
A front-end application created using the Predix Seed app—the front-end application enables us to see the health of a greenhouse farm (Figure 9). If something goes wrong, it is possible to open the details for every greenhouse and find the zone where the failure occurs (Figure 10).
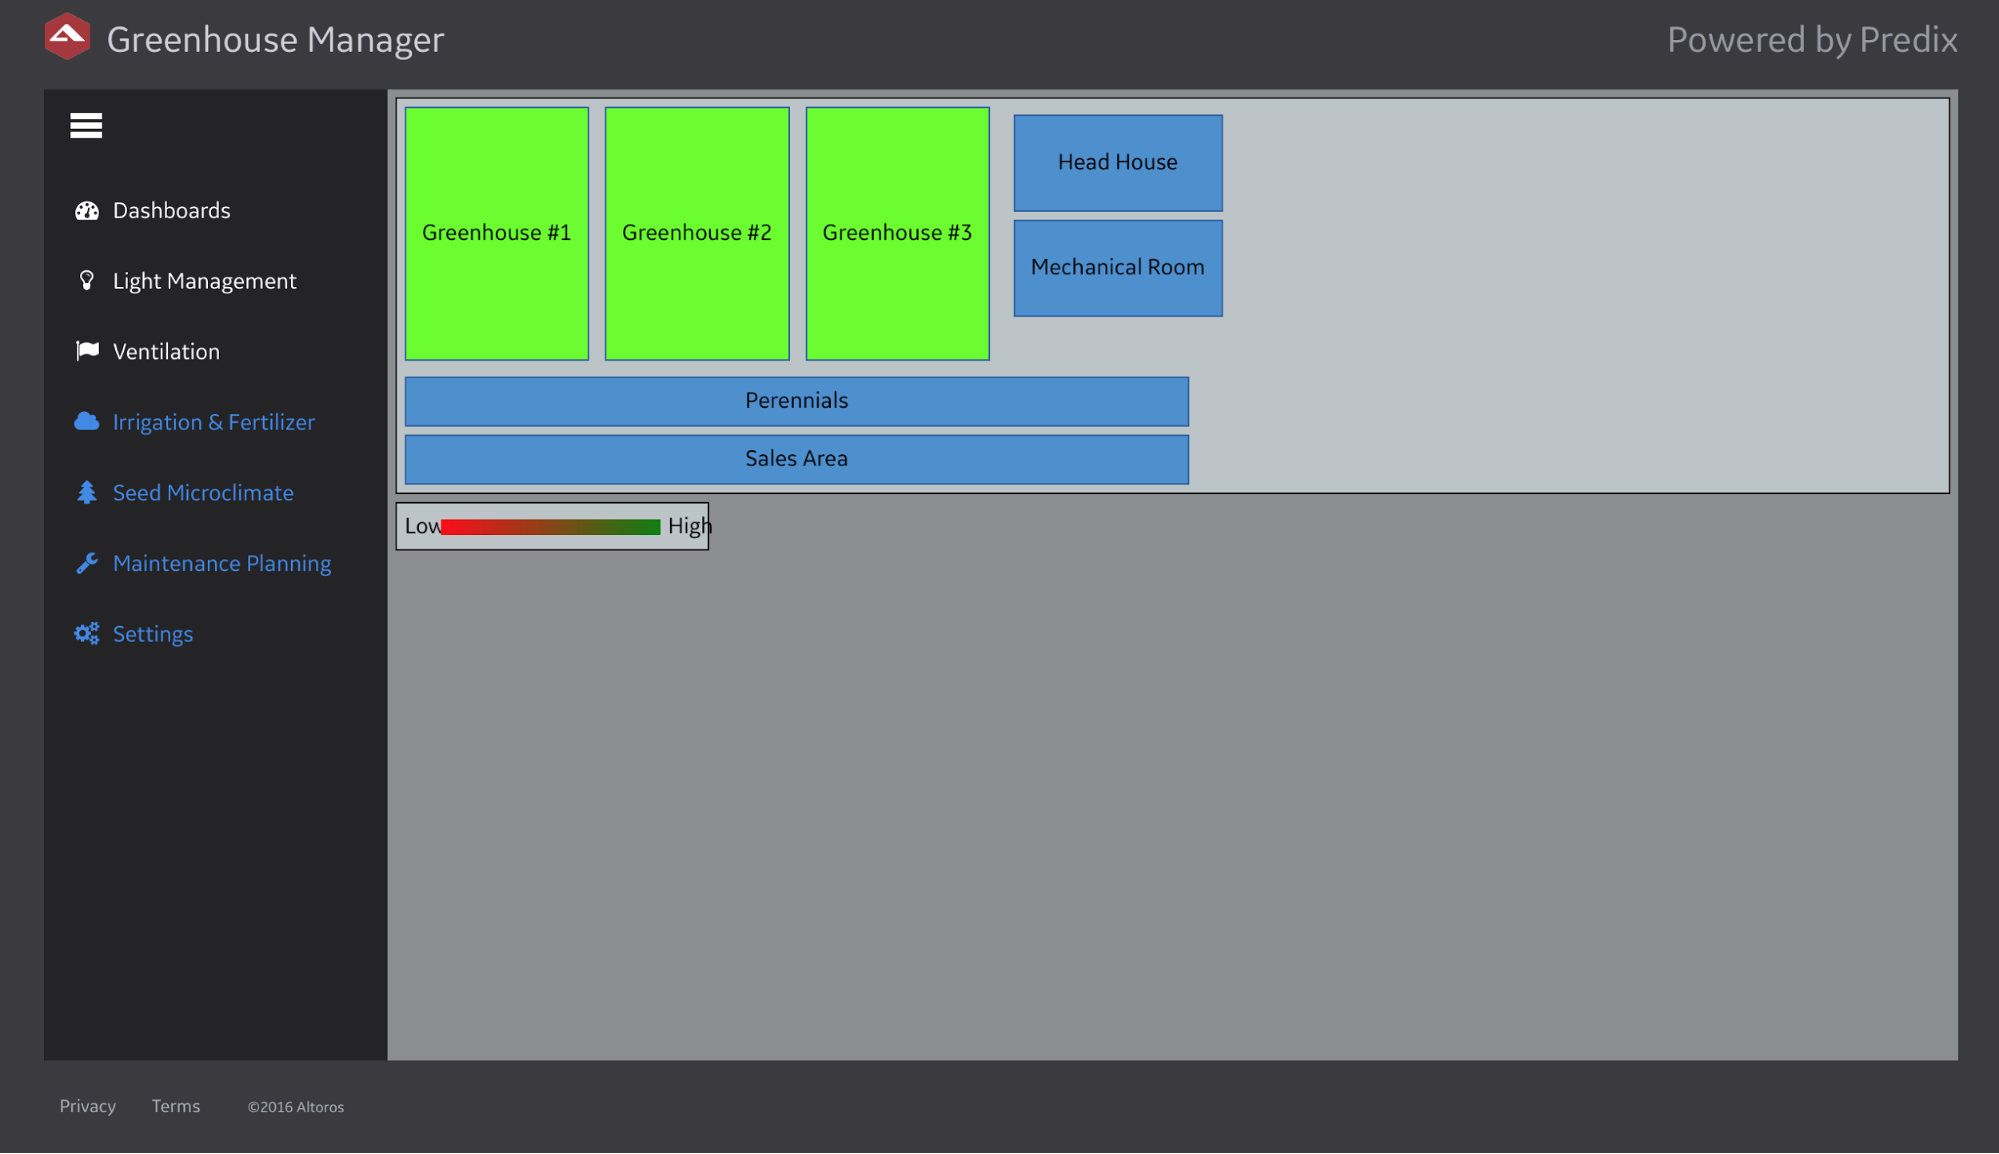 Figure 9. Dashboard of the greenhouse management app
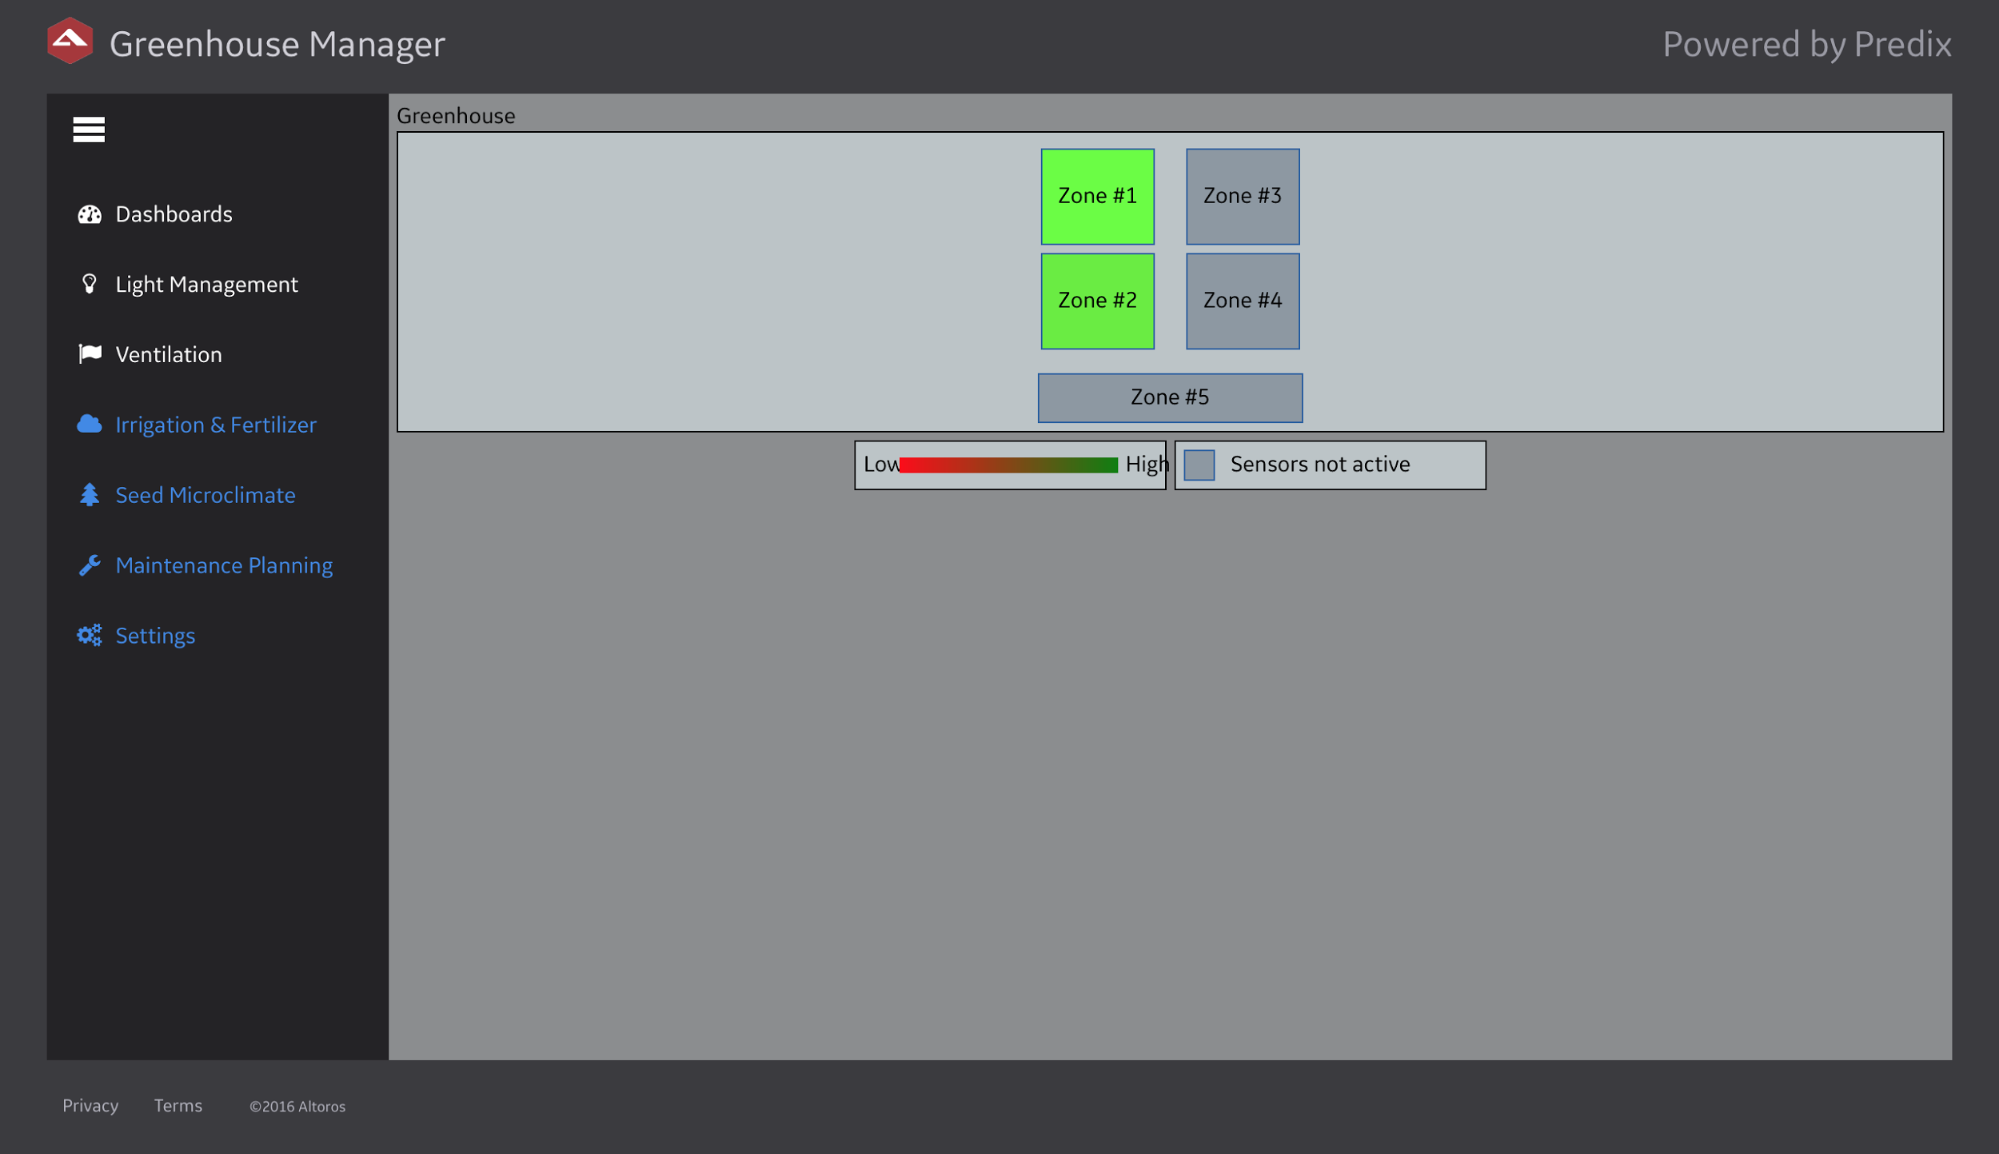 Figure 10. Selected greenhouse health highlighting
Using GE Predix, it was quite easy to create such a basic front-end app. Check out the code here.
Also, you can see charts with the data received from the sensors (Figure 11).
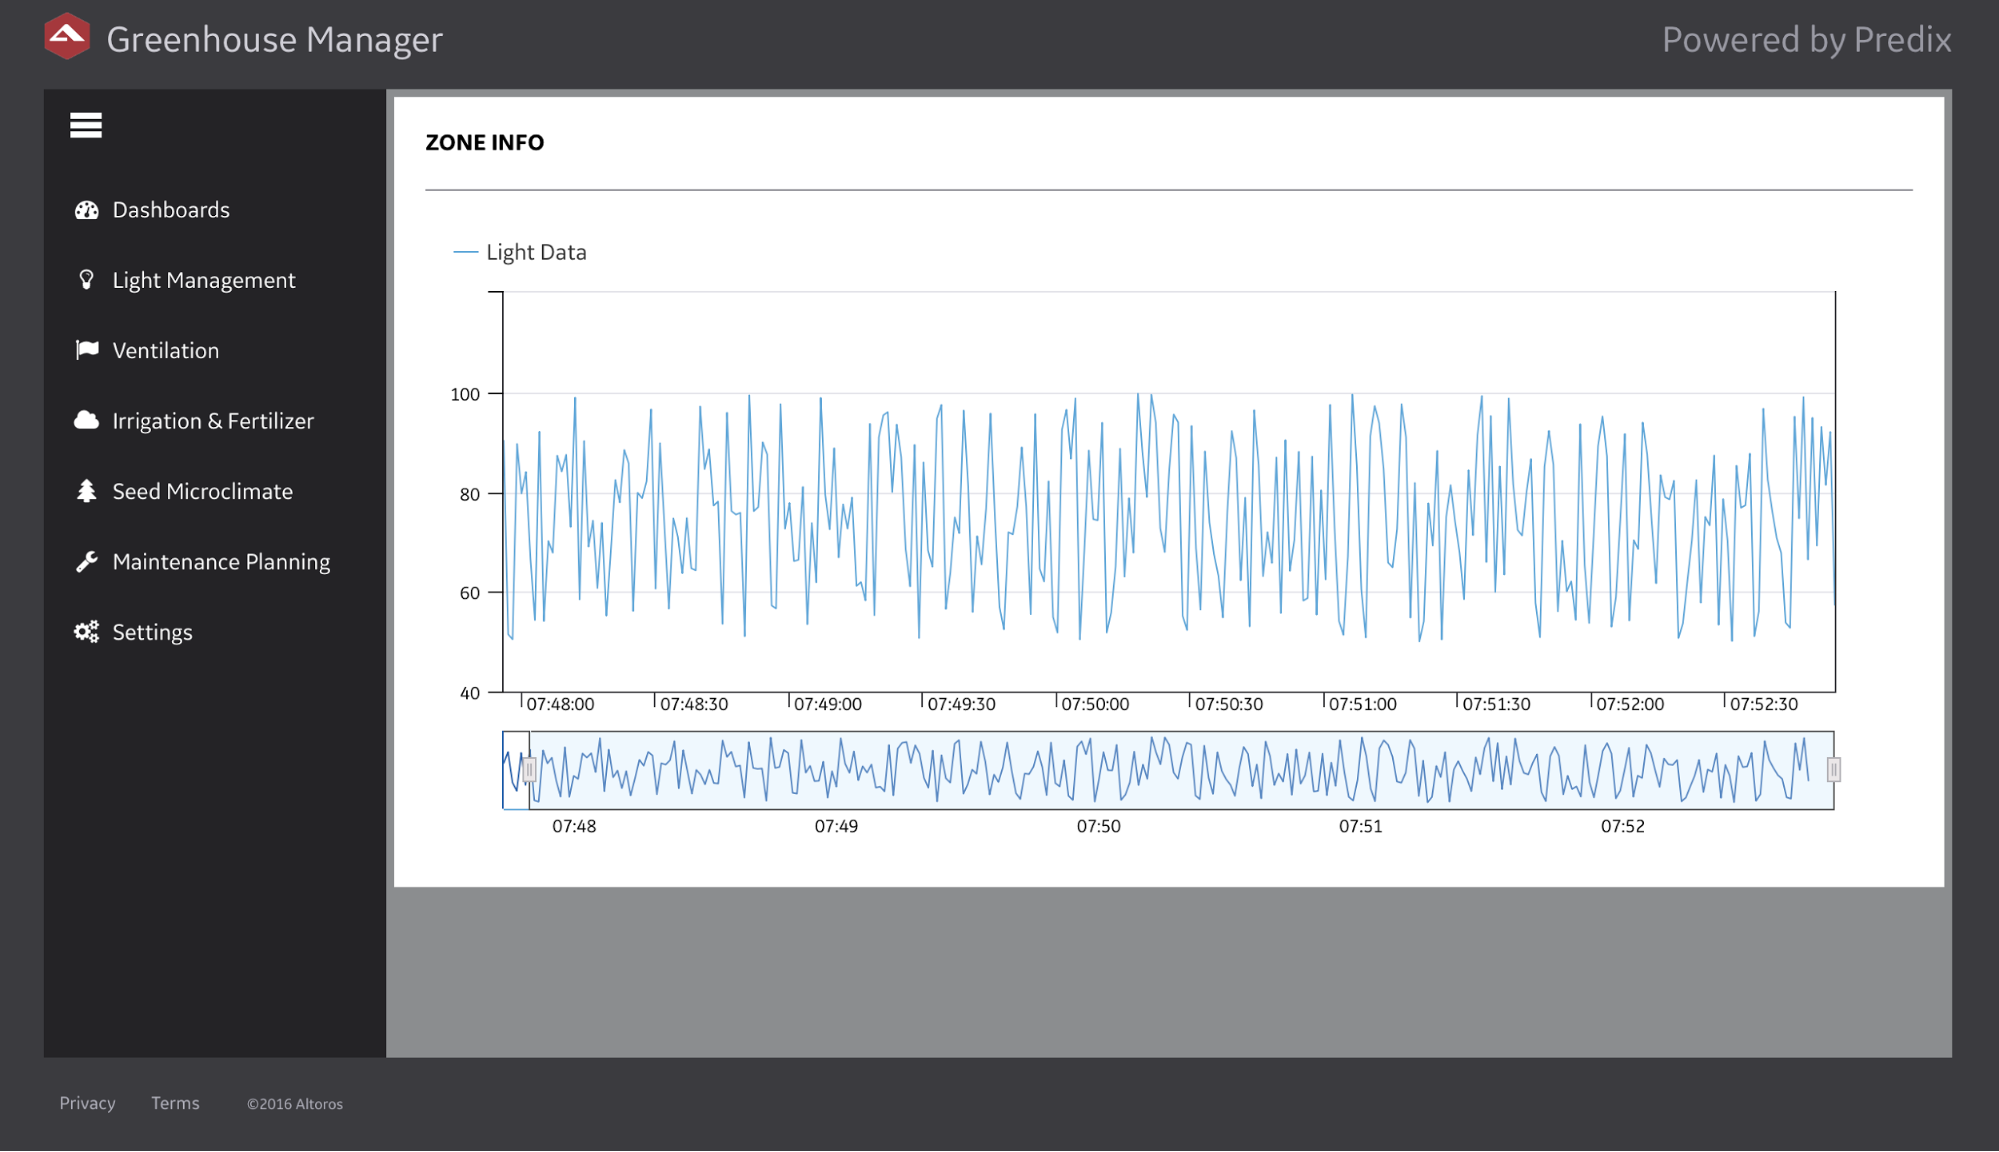 Figure 11. Light data details
To implement this app, we used AngularJS, Predix Seed, Polymer, and the Predix UI components. Here’s the source code for the chart app: chart.js and chart.html.
Conclusions
The main difficulties we encountered while creating our greenhouse management system were related to the integration of the TSL2561 component (light sensor) with Raspberry Pi using I2C.
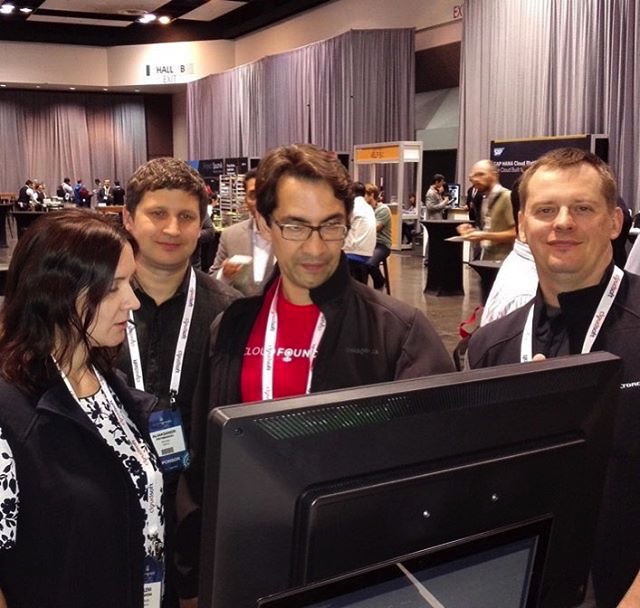 Figure 12. Demonstrating the prototype to Sam Ramji during the Cloud Foundry Summit 2016
At the same time, we found out that Node-RED is a rather good fit for making prototypes on both sides: on edge and for a cloud-based implementation of the back end. The stability of Predix and its services was sufficient for prototyping. However, for production development, it would be great to wait until Predix becomes even more reliable.
When working with the Predix Time Series service, there were several significant delays between the data ingestion and the time when it was ready to be read on some workloads. We think that the platform stability might be the reason, and this behavior will be improved in the future.
This prototype was created by my colleague Igor Razhnov and me. Let us know if you want a demo or need assistance in creating a similar prototype in 48 hours.
Further reading
- IoT Prototype: Light Monitoring with NodeRED Components in Predix
- How to Set Up Predix Analytics Services and Use Them from a Node.js App
- How to Use Snap Packages when Collecting IoT Data with Predix Time Series