Data Visualization Tools: Flot vs. Highcharts vs. D3.js

Preview a comparison table
Today, web applications deal with massive data sets that require highly performant systems for processing and analysis. However, information becomes even more valuable, if you can efficiently visualize it.
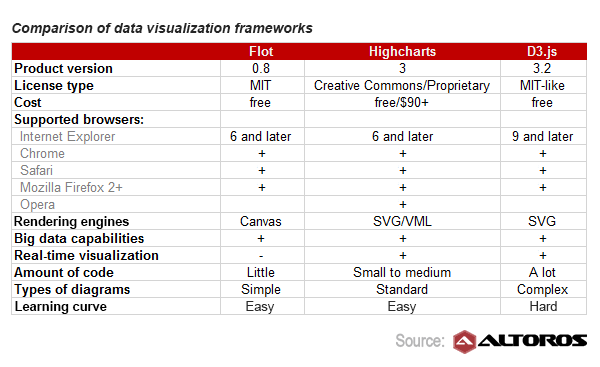
Our Lead Front-End Engineer Igor Zalutski has prepared a comparison of three wide-spread, yet different, JavaScript libraries to see how they cope with big data and real-time visualization. The tools were selected based on popularity, performance, implementation approach, and relevance:
- Flot, an open-source jQuery plug-in designed for drawing diagrams in Canvas
- Highcharts, one of the most popular proprietary libraries
- D3.js, a large open-source framework for data visualization
Below is a brief comparative table that will give you a general idea of what big data and real-time visualization capabilities you can expect from these tools.
 An evaluation of Flot, Highcharts, and D3.js
For those interested in the topic, a comparison table on Wikipedia may also be useful—however, it only focuses on feature availability.
To get a more detailed analysis of Flot, Highcharts, and D3.js with 16 sample diagrams, a vendor-independent overview, as well as information on required code size, platform support, etc., download the full research paper.